How Much Is Slippage Really Costing Your Trading Strategy?
TL;DR. Slippage — the gap between the price you ask for and the price you get — is the cost almost nobody measures and everybody pays. On a single fill it's a fraction of a pip. Over ten thousand fills it's the difference between a profitable backtest and a losing live account. PortQuant's new Execution Quality view measures it from your own deal history: in pips, broken down by order type, with fill latency, and compared side by side across brokers.
The cost nobody puts a number on
Ask most algo traders how their system is performing and you'll get a profit factor, a win rate, maybe a Sharpe ratio. Ask them how many pips they lose to slippage on a typical stop entry, and you'll usually get a shrug.
That shrug is expensive.
Slippage is one of the few costs in trading that compounds silently. On any single fill it's tiny — a fraction of a pip here, a point of an index there. Nobody notices. But run a strategy ten thousand times and that "rounding error" turns into a line item big enough to flip a profitable backtest into a losing live account. The math doesn't care that you weren't looking.
So we built a way to look. Execution Quality measures, for every strategy you run, exactly what your fills are costing you. Not estimated. Measured.
Why slippage hides so well
Here's the uncomfortable part: most platforms don't show slippage in any honest way, and there's a technical reason for it.
When you send a market order on MT5, the platform doesn't store the price you intended — only the price you got. There's nothing to compare against, so slippage on a market order is, strictly speaking, unmeasurable after the fact. A lot of tools paper over this with guesses. We'd rather tell you the truth.
What is measurable are the orders that carry a reference price: stop entries, limit entries, and exits triggered by a stop-loss or take-profit level. Those have a number the broker was supposed to honour, so we can measure how far the real fill drifted from it. That's where the cleanest signal lives, and that's what we surface first.
What Execution Quality actually shows you
Open the tab and you get one row per strategy — grouped the way you think about your strategies, so a single system spread across several magic numbers is pooled under one name instead of scattered. Click into any strategy and you get the full breakdown:
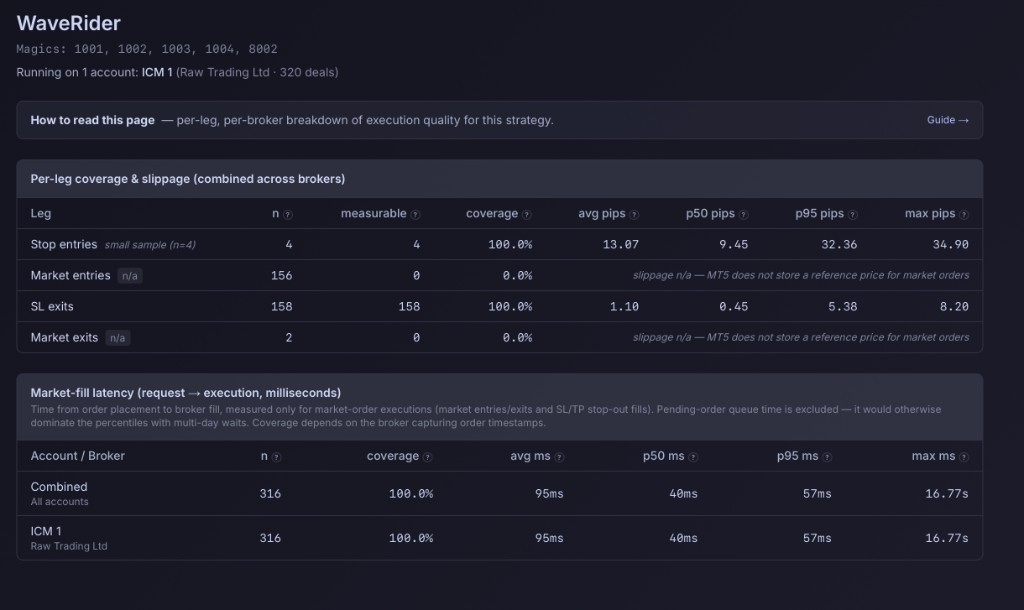
Take the strategy above as a real example. Its stop-loss exits — 158 of them, fully measured — fill at a median of just 0.45 pips of slippage, with a worst-decile (p95) of 5.38 and a single worst fill of 8.20. Its market entries and exits, by contrast, read "n/a", because MT5 never stored a reference price to compare against. One screen, and you know precisely where this strategy's execution is clean and where it simply can't be measured. That's the whole idea.
Here's what each column is telling you:
Slippage in pips, as a distribution — not a single misleading average. We show the median (p50) for the typical case and the 95th percentile (p95) for the bad days, because the average hides exactly the tail risk you care about. The sign matters too: a positive number means you were filled worse than you asked, and a negative number means the broker actually filled you better — yes, that happens, and you should know when it does.
A breakdown by order type. Stop entries, limit entries, stop-loss exits and take-profit exits each get their own line. This matters more than it sounds. A strategy can have beautiful limit-entry fills and brutal stop-loss exits, and a blended number would hide both. Separating them tells you where in the trade lifecycle the leakage happens.
Fill latency in milliseconds. How long from the moment your order leaves to the moment it's filled — 40 ms median in the example above, with pending-order queue time deliberately excluded so multi-day waits don't pollute the number. On fast markets, latency and slippage tend to travel together, so it's useful context — though pips, not milliseconds, stay the headline.
The feature we're quietly proud of: broker comparison
If you run the same strategy on more than one broker, Execution Quality puts them side by side.
This is the kind of thing traders argue about endlessly in forums — "Broker A slips me more than Broker B" — almost always based on a gut feeling and three or four memorable bad fills. Now you can settle it with your own data. Same strategy, same logic, two or three brokers, and a clear answer about which one actually fills you cleanest over hundreds of trades.
We've watched this surprise people, ourselves included. A broker with the tightest advertised spreads can turn out to be the worse executor once you account for the fills. You don't learn that from a marketing page. You learn it from your own fill history — which is the only sample that's actually about your orders, at your times of day, on your symbols.
"Filled at requested" — and why we flag it
Some brokers report every fill at exactly the requested price. On screen that looks like flawless execution: zero slippage, every time.
It usually isn't. More often it means the broker simply doesn't preserve the original request in the data we receive, so the "slippage" reads as zero because there's nothing to compare. Reporting that as perfect execution would be dishonest, so we don't. When we see the pattern hold across a meaningful sample, we label it plainly: fills at requested. It's a statement about the data, not a gold star for the broker. If we can't measure something, we'd rather say so than invent precision.
Built for more than forex
A pip means something different on EUR/USD than it does on gold, an index, or Bitcoin — and a lot of analytics tools get this wrong by bolting one formula onto everything. The classic mistake is treating an index point like a forex pip and reporting a fill that slipped 220 index points as "22,000 pips", which is nonsense.
We handle each asset class with its own convention: standard pip sizing for forex pairs, the trader's convention for gold and silver, index points for indices, and quote-currency units for crypto. So whether your strategy trades EUR/USD, XAU/USD, US30 or BTC/USD, the number you read is the number that means something.
How to start measuring your own slippage
If you're already syncing trades to PortQuant with a recent version of our collector EA, your strategies are probably populating the Execution Quality view right now — head to Analyze → Execution Quality and start with your highest-volume systems, where the sample size makes the percentiles trustworthy. It sits alongside the other "measure what the broker statement hides" tools in Exposure & Risk Control: real equity drawdown, per-trade excursion, the lot.
A few honest caveats, because they matter:
- Slippage only shows up where there's a reference price — stop/limit entries and SL/TP exits. Pure market-order strategies will show "n/a", and that's a limitation of the platform data, not a bug.
- Small samples make percentiles noisy. We flag low counts so you don't over-read a number built on a handful of trades.
- The headline is price slippage in pips. Latency is supporting context, not the scoreboard.
The point of all this
You can't fix a cost you've never measured. For most traders, slippage has been exactly that — a vague, unmeasured drag they assume is "probably fine".
It might be. But "probably fine" isn't a number, and trading runs on numbers. It's the same blind spot we wrote about with equity drawdown vs balance drawdown and maximum adverse excursion: the broker statement quietly omits the costs that actually decide whether a strategy survives. Execution Quality turns one more of them — one of the last unexamined costs in retail algo trading — into something you can actually see, compare, and act on.
So here's the question worth sitting with: if you measured your slippage per strategy tomorrow, are you confident it would say what you hope it does? There's one way to find out.
Frequently Asked Questions
What is slippage in forex trading?
Slippage is the difference between the price you requested and the price your order was actually filled at. It happens because the market moves in the milliseconds between your order leaving and the broker executing it, and because available liquidity at your exact price may be limited. Positive slippage means you were filled worse than you asked; negative slippage means you were filled better. On a single trade it's usually small, but across thousands of fills it becomes a material cost that can erase the edge a backtest promised.
How do you measure slippage on MT4/MT5?
You compare the price the order was meant to fill at against the price it actually filled at, then express the gap in pips. The catch is that MT5 only stores a reference price for orders that have one — stop entries, limit entries, and stop-loss/take-profit exits. Market orders don't retain the requested price, so their slippage is structurally unmeasurable after the fact. PortQuant's Execution Quality view measures slippage only where a genuine reference price exists, and clearly marks the rest as "n/a" rather than guessing.
Why is my slippage different on different brokers?
Because execution quality is a property of the broker, not just the strategy. Liquidity, order routing, server location, and how the broker handles stop and limit orders all change the fills you get. The same EA, running identical logic, can slip noticeably more on one broker than another. A broker with tight advertised spreads isn't automatically the better executor once you account for slippage — which is exactly why PortQuant lets you compare the same strategy across brokers, in pips, side by side.
What does "fills at requested" mean?
It means a broker reports every fill at exactly the price requested, so the measured slippage is always zero. Sometimes that reflects genuinely tight execution, but more often it means the broker simply doesn't preserve the original requested price in the data, so there's nothing to compare against. PortQuant flags this pattern explicitly instead of presenting it as flawless execution — it's a statement about what the data can and can't show, not proof of perfect fills.
Is fill latency the same as slippage?
No, but they're related. Fill latency is the time between placing an order and having it filled, measured in milliseconds. Slippage is the price difference on that fill, measured in pips. On fast-moving markets, higher latency tends to produce more slippage because the price has more time to move before you're filled — so latency is useful supporting context. But price slippage in pips is the metric that directly hits your P&L, which is why PortQuant treats pips as the headline and latency as context.
How many trades do I need before slippage numbers are reliable?
Enough that the percentiles aren't dominated by a few outliers. As a rough guide, a few dozen measurable fills per leg starts to be informative for the median, and you want more before trusting the p95 (worst-decile) figure. PortQuant flags small samples so you don't over-interpret a number built on a handful of trades. The best place to start is your highest-volume strategies, where there's enough history for the distribution to mean something.