Correlation in Forex Portfolios: The Hidden Driver of Equity Drawdown
TL;DR. If two of your strategies' daily returns correlate at +0.85, you don't have two strategies. You have one strategy at twice the size, and roughly double the drawdown when it goes wrong. The same mechanism — multiple positions losing together at the same minute — is what pushes equity drawdown on live MT4/MT5 accounts up to 8.5x higher than the balance drawdown a broker statement shows.
The two correlations that actually matter
Almost everything written about "forex correlation" is really about one question: do EUR/USD and GBP/USD tend to move together? That's worth knowing. It's also the smaller of the two problems if you're running EAs.
Two separate things both get called correlation:
Pair correlation asks whether two currency pairs' prices move in sync. EUR/USD and GBP/USD often run at +0.7 to +0.9 against the dollar. Useful if you're placing manual trades on different pairs and want to know whether you're really making independent bets.
Strategy correlation asks whether two strategies' daily returns move together. Two grid EAs on XAUUSD at the same broker can sit at ρ = 0.9 even though they're nominally different strategies. They draw down the same week. They blow up on the same news. They both love low volatility and hate the same Tuesdays.
For anyone running multiple EAs, the second one is where the silent risk lives. Two EAs can trade completely different symbols and still draw down together. Two EAs can trade the same symbol and look uncorrelated. The pair label tells you almost nothing about whether they actually diversify.
How the correlation number is read
People throw around "correlation" as a single number ρ between −1 and +1. The plain-language version is: ρ measures whether two series' deviations from their own averages tend to point the same way. +1 means they always move together, −1 means they always move opposite, 0 means they move independently. It's computed on the returns of the two series — never on prices, never on equity levels.
A toy version with five days of returns for two pretend strategies:
| Day | Strategy A | Strategy B |
|---|---|---|
| 1 | +0.8% | +0.6% |
| 2 | −1.2% | −0.9% |
| 3 | +0.3% | +0.1% |
| 4 | +1.5% | +1.4% |
| 5 | −0.4% | −0.5% |
Run the numbers and ρ comes out around 0.98. You can see it just by reading the table — every day they move the same direction by similar amounts. Two "different" strategies, basically one bet.
The things people get wrong are:
Always compute on returns, not on equity levels. Two equity curves that both drift up will show ρ ≈ 0.99 on raw values and ρ ≈ 0.1 on daily returns. Only the second number tells you anything.
Match the window to your holding period. A 200-day correlation on a strategy you hold for hours is historical wallpaper. Day traders want 20–60 days of daily returns. Swing traders want 60–90. Refresh weekly.
ρ isn't linear in consequence. Moving from 0.3 to 0.6 is a much bigger jump in joint risk than moving from −0.6 to −0.3, even though both are increments of 0.3. The damage scales with what correlation does inside the portfolio variance formula — which is the next thing to look at.
What correlation does to portfolio risk
The intuition first, in two sentences:
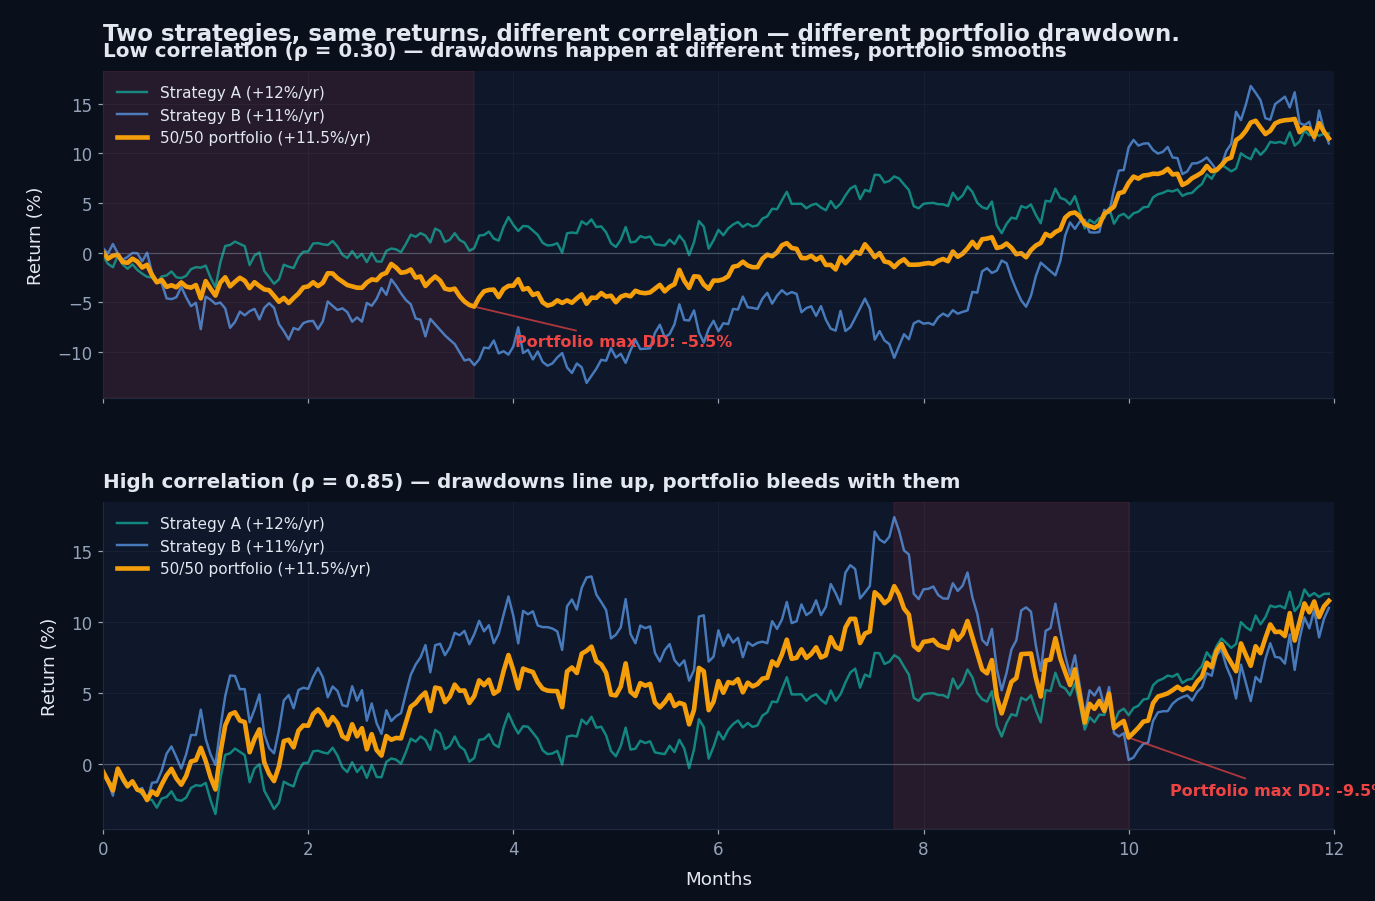
If two equity curves draw down on the same day, the combined drawdown is roughly the average of the two.
If they draw down on different days, the combined drawdown is much smaller, because while one is bleeding the other is sitting near its high-water mark.
Here's that effect shown on synthetic data — two strategies with the same individual return (+12% and +11%/yr) run as a 50/50 portfolio, once at low correlation and once at high:
The formula behind this, for the two-strategy case, is:
σ²_portfolio = w₁² σ₁² + w₂² σ₂² + 2 w₁ w₂ ρ σ₁ σ₂
That middle term is the correlation tax. Positive ρ adds to portfolio risk. Negative ρ subtracts. ρ = 0 makes it disappear and the two risks are independent. The same shape generalises to N strategies (every pair contributes a cross-term), which is why portfolios with lots of low-correlation strategies smooth out more than portfolios with a few high-correlation ones.
The whole thing in one chart
Take the two strategies from above:
- Strategy A: +12%/yr, 15% historical max drawdown
- Strategy B: +11%/yr, 14% historical max drawdown
Run 50/50. Expected return is 11.5%/yr regardless of which correlation you assume. The Calmar ratio (return ÷ drawdown) tells you what diversification is actually paying for, and it depends entirely on ρ:
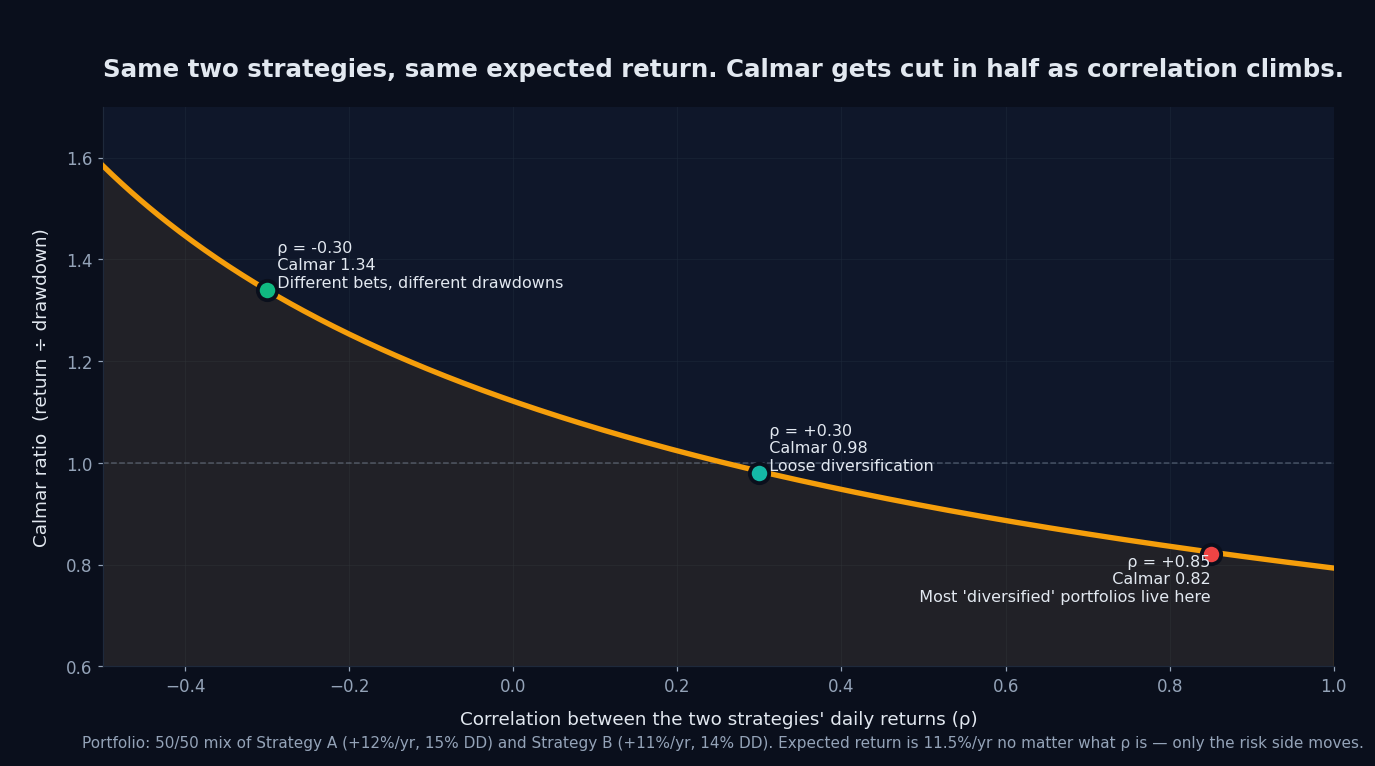
Same trades, same EAs, same broker, same expected return. The Calmar ratio swings from 0.79 to 1.32 purely from the correlation number. That gap is what diversification actually pays — and what "I run multiple EAs so I'm diversified" costs you when ρ turns out to be high.
Correlation breaks when you need it most
Correlation isn't a constant. Three recent examples of what happens under stress:
January 15, 2015. The Swiss National Bank dropped the EUR/CHF floor. EUR/CHF fell roughly 30% in minutes, but the more interesting effect was second-order: risk-off sentiment dragged correlations across CHF pairs and the major dollar pairs toward 1, and accounts that thought they had diversified directional exposure all moved together.
March 2020. The COVID liquidity crisis. Almost everything fell against the dollar at the same time, including traditional safe havens. Pairs that had been running at ρ = 0.3 hit ρ = 0.9 in a single session. The "flight to dollar cash" overrode every normal regime distinction for about a month.
August 2024. The yen-carry unwind compressed risk correlations again, then released them unevenly over the following weeks. The matrix you measured in July was useless by August 6.
The pattern is the same every time. The covariance matrix you measured last quarter stops describing the one you're actually exposed to, exactly when you most need it to.
Two practical responses:
Stress-test at ρ = 0.9 across the board, not at your measured ρ. Size as if a regime shift will happen at some point, because at some point it will and you won't time the exit.
Re-measure on a rolling window. Stale ρ is worse than no ρ, because it gives you a confidence interval the data doesn't support. Match the window to your holding period and update it weekly.
Where correlation actually hides in an MT4/MT5 portfolio
Concentration rarely shows up labelled. The clusters that produce most of the silent ρ are these:
| Cluster type | What it looks like | Why ρ is high |
|---|---|---|
| Same broker, same symbol, multiple EAs | Two XAUUSD grid EAs at the same broker | Identical spread, swap, liquidity gaps. They fail on the same fills. |
| Same signal family | RSI mean-reversion EAs on three different pairs | Mean reversion is one regime bet. All three lose during trending months. |
| Same volatility preference | Low-vol scalpers and low-vol carry trades | Both rely on suppressed vol. Both crater on the same VIX spike. |
| Dollar cluster | Long EUR/USD + GBP/USD + AUD/USD + short USD/JPY | One directional bet on USD weakness, four positions deep. |
| News-sensitive cluster | Multiple EAs that hold through NFP / FOMC | Co-movement concentrates on a handful of minutes per month. |
Drawn out as a correlation matrix on real-looking strategies, the clusters become impossible to miss:
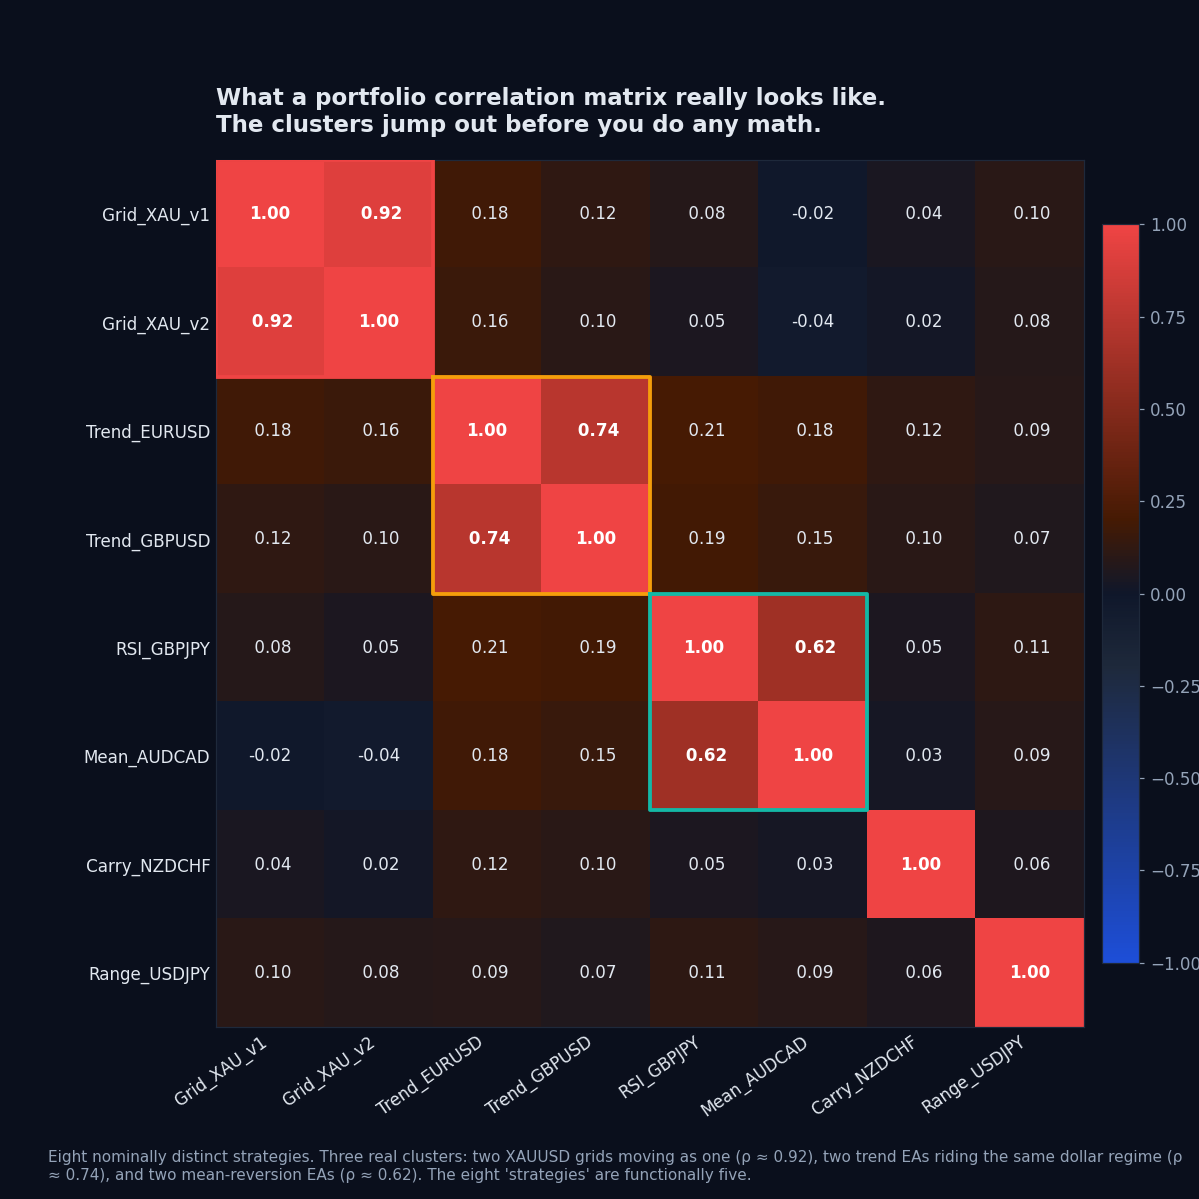
Quick way to spot them without a matrix: if you can describe two of your strategies with the same one-sentence summary, they're correlated. "Both profit from quiet EU sessions." "Both are short-vol bets." "Both lean long on the dollar." The fact that one trades EUR/USD and the other AUD/USD doesn't make them independent if they react to the same conditions.
How this shows up in PortQuant
Portfolio Engineering builds exactly this kind of strategy-by-strategy correlation matrix on every project, computed from the daily returns of each strategy's reconstructed equity curve (not from price levels). That matrix feeds three things during portfolio assembly:
- Correlation dedup. Default threshold of 0.70, tunable per project. When two qualified strategies cross it, the lower-scoring one is dropped from the portfolio and the rejection reason names the partner that pushed it out.
- Instrument and grid/MG caps. Stacked on top of the correlation filter, to catch the overlap that the daily-return ρ misses — two strategies on the same symbol that happened to trade at different hours in-sample, or two grid EAs that staggered their drawdowns historically but share the same structural risk.
- Average pairwise correlation as a reported metric. Shows up on every optimized portfolio. If it climbs above your comfort level, the portfolio is doing less than the strategy count suggests.
For live accounts (not backtests), correlation is also what creates the gap between balance and equity drawdown. When six grid trades on EUR/USD and three pending positions on GBP/USD are all underwater at the same minute, balance shows nothing — nothing has closed. Equity shows −$1,800. Across 100+ live MT4/MT5 accounts on PortQuant the balance-to-equity DD gap averages 2.1x and reaches 8.5x, and the cause is the same every time: positions the trader believed were independent turned out to draw down together. The mechanism is in Equity Drawdown vs Balance Drawdown.
The forward-looking version of the same thing is in the Monte Carlo post, which shows a single grid account where balance-only MC reports P95 drawdown of 2% while equity-aware MC on the same trades reports P95 of 16%. That 8x difference is, again, correlation between simultaneously-open positions doing its thing.
Practical rules
A few worth pre-committing to so emotion doesn't get a vote when the matrix shifts:
- Aim for average pairwise ρ under 0.5 across the portfolio. Anything above 0.7 is one bet wearing multiple hats.
- Any single pair above 0.85 should be treated as one strategy for sizing. Drop one or split the allocation.
- Recalculate ρ on a rolling window matched to your holding period. Daily returns, 60 days, refreshed weekly is a reasonable default for most algo traders.
- Stress-test assuming ρ = 0.9 everywhere. If the resulting drawdown is unacceptable, size down now, not after the event.
- Compute ρ on returns. Not on prices, not on cumulative equity. First differences only.
- Watch the trend, not just the level. A weekly ρ̄ that's been rising over a quarter is a rebalance signal even if it hasn't crossed your threshold yet.
- Pair the correlation view with the realised side. Account-level exposure and risk control is where you see whether the matrix prediction actually held.
Frequently Asked Questions
Is currency pair correlation the same as strategy correlation?
No, and mixing them up is the most common mistake in this whole topic. Pair correlation is a property of the market — do EUR/USD and GBP/USD tend to move together. Strategy correlation is a property of how your strategies react to the market. Two strategies on negatively-correlated pairs can still have ρ = +0.9 on returns if they both profit from low volatility. For multi-EA accounts, strategy correlation is the one that determines whether the portfolio diversifies. Pair correlation matters mostly for manual traders placing single positions.
What correlation threshold should trigger action?
A defensible default for MT4/MT5 portfolios: anything above +0.85 between two strategies should be treated as one strategy for position sizing, and an average pairwise ρ above +0.70 across the portfolio is a concentration warning. PortQuant's Portfolio Engineering uses 0.70 as its default dedup threshold for the same reason — conservative enough to catch genuine redundancy, loose enough to keep complementary strategies in the pool.
How often should I recalculate correlations?
Match the cadence to how long you hold positions. Day traders should refresh weekly on a 20–60 day window. Swing traders monthly on a 60–90 day window. Position traders quarterly on a 200-day window. And always after an obvious regime event — central bank surprise, big VIX move, anything that visibly rewrote the matrix. Those events change the correlations before they change your strategies.
Why is my equity drawdown so much larger than my balance drawdown?
Balance only updates when trades close. Equity updates continuously. When multiple open positions are correlated and all underwater at the same minute, balance shows nothing happening while equity is down across all of them. Across the live MT4/MT5 accounts PortQuant has measured, the gap averages 2.1x and reaches 8.5x. A real example: 29 profitable strategies on one account showed 6.6% balance drawdown but 56.3% equity drawdown — the trader was over halfway to zero and never saw it on the broker statement. The full mechanism is in Equity Drawdown vs Balance Drawdown.
Can correlations between previously independent strategies suddenly spike?
Yes, which is why historical ρ is a floor on your risk estimate, not a ceiling. Crisis events compress the matrix toward 1 across almost all risk assets — the 2015 SNB shock, March 2020, and the August 2024 yen-carry unwind are recent examples. Strategies that ran at 0.3 for years can hit 0.9 inside a session. Stress-testing your portfolio at ρ = 0.9 across the board, instead of at your measured ρ, is the only honest way to size for these regimes.
Does negative correlation make a good hedge?
Sometimes, with two costs traders underestimate. First, a strategy at ρ = −0.8 to your main book gives back roughly 80% of the main book's returns in expectation, not just 80% of its risk. You're paying for the hedge in foregone P&L every day, not just during the drawdown you wanted to protect against. Second, negative correlations are even less stable than positive ones; the "safe-haven" pairs that hedge dollar risk in normal markets sometimes co-move with the dollar during liquidity crises. Most portfolios benefit more from low correlation across many independent bets than from negative correlation between two large opposing ones.
How many strategies should I track for correlation?
Track every strategy that's run in any of your live accounts in the past N days, where N is your recalculation window. For a typical multi-EA MT4/MT5 trader that's 5–15 strategies. For portfolio research across many backtests it can be hundreds. The number isn't really the point. What matters is the ratio of independent bets to correlated clusters. A pool of 20 strategies that collapses to 3 clusters at ρ > 0.7 is functionally a 3-strategy portfolio, no matter how many lines it shows in the dashboard.